震度別の市区町村数(区域内の最大震度)Municipalities by intensity (the strongest anywhere in each)
このアプリの数字は、防災の学習と研究のための推計です。震度は断層からの距離と地盤から出した「平均的にはこのくらい」の値で、実際は場所によって 1 段ほど上下します。被害は国の被害想定の方法を簡略にして数えたもので、実際の地震の被害とは何倍も違うことがあります。避難や備えの判断は、自治体のハザードマップと気象庁の情報で行ってください。The numbers in this app are estimates for disaster education and research. The intensity is an average value from the distance to the fault and the ground, and the real intensity varies by about one level from place to place. Damage is counted with a simplified version of the Japanese government's method and can differ from a real earthquake several times over. For decisions about evacuation and preparation, use your local hazard maps and information from the Japan Meteorological Agency.
このシミュレーターについて
- 地震の揺れと被害を簡略な計算で推計するシミュレーターです。防災の学習と研究の参考として作っていて、実際に起きる地震の被害を予測するものではありません
- 死者数・全壊棟数・浸水域の人口は、推計の半分から 2 倍の幅で示します。過去の地震の記録や国の想定と比べると、この計算は 0.6〜1.6 倍ほどずれるためです。時刻は国の想定と同じ 3 つ(冬の深夜・夏の昼 12 時・冬の夕方 18 時)から選べます。昼は家にいる人が少ないので建物倒壊の死者が減り、火を使う人が多い冬の夕方は火災が大きくなります
- 過去の大地震は、計算を実際の記録と比べて確かめるため、また教訓を伝えるために載せています。被害の数字は、同じ地震が今の建物で起きた場合の推計で、実際に起きた被害とは別のものです。犠牲になられた方々に哀悼の意を表し、被災されたすべての方に心からお見舞い申し上げます
使い方
- 地図上の地点を選ぶと、その地点の震度と被害の推計を表示します。「ここを震源にする」を選ぶと、その地点を震源として計算します。マグニチュード・深さ・断層の向きを変えると、すぐ再計算します
- 「想定地震」では南海トラフ巨大地震と首都直下地震を、国が公表している被害想定と並べて表示します。南海トラフは破壊開始点も選べます
- 「過去の大地震」では、計算した震度と実際に観測された震度、被害の記録(亡くなった人の主な原因を含む)を並べます
- 死者数は、死因が「建物倒壊」「津波」「火災」のどれに多いかを割合で示します。津波が発生する地震では、すぐ避難する人の割合(2 割・7 割・全員)を変えると、津波による死者数の変化を比べられます。風の強さ(風速 3 m・8 m)を変えると、火災の燃え広がりが変わります
- 揺れが到達した地域から色が付きます。時刻は地震発生からの実際の経過時間で、画面は早送りで表示しています
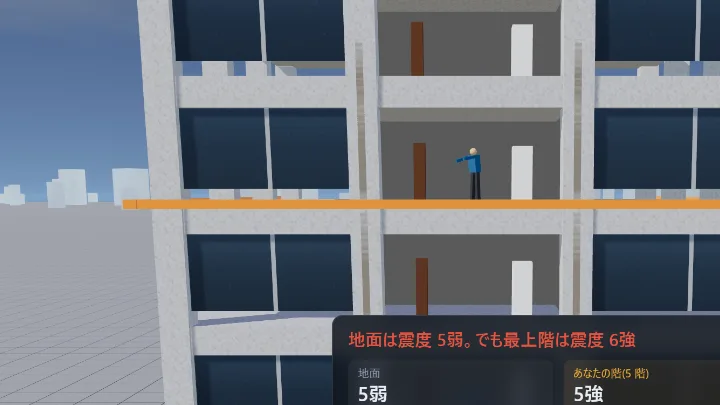
- 地点の情報から「建物の階ごとの揺れ」を選ぶと、同じ震度を地震ゆれシミュレーターで確認できます
- 条件(地震・時刻・風・すぐ避難する人の割合)はページのアドレスに入るので、そのまま共有できます
- 地図はドラッグで動かせます。拡大と縮小は右上のボタンか、Ctrl を押しながらホイール。スマホは 2 本の指でつまみます
計算方法と出典
計算は国や研究機関が公表している手法とデータを組み合わせ、簡略にしたものです。段階ごとに、使った式とデータ、出典、このアプリが独自に決めた部分(公的な手法ではない部分)を示します。
1. 断層の大きさ
内陸の活断層とプレート内の地震は、マグニチュード M から断層の長さ L を L = 100.6M−2.9 km で決めます。海溝型の地震は、断層の面積 S を log S = 1.02M − 4.01 で決めます。想定地震と過去の地震は、国の想定や記録に合わせて断層を置いています。
出典:松田時彦(1975)活断層から発生する地震の規模と周期について、地震 第 2 輯 28、269–283/宇津徳治・関彰(1955)余震区域の面積と本震のエネルギーとの関係、地震 第 2 輯 7、233–240
このアプリで決めたこと:断層の幅の上限(内陸 20 km・プレート内 30 km・海溝型 200 km)
2. 揺れ(震度)
断層面から各地点までの最短距離で、硬い地盤(S 波速度 600 m/s)での最大速度を求め、1.31 倍して工学的基盤(400 m/s)の値に直します。そこに表層地盤の増幅率を掛けて地表の最大速度とし、計測震度に換算します。地震調査研究推進本部の全国地震動予測地図で使われている「簡便法」と同じ手順です。揺れの到達時刻は、断層の破壊が秒速 2.7 km、S 波が秒速 3.5 km で広がるとして求めます。
出典:地震調査研究推進本部 地震調査委員会「全国地震動予測地図」/司宏俊・翠川三郎(1999)断層タイプ及び地盤条件を考慮した最大加速度・最大速度の距離減衰式、日本建築学会構造系論文集 第 523 号/松岡昌志・翠川三郎(1994)国土数値情報とサイスミックマイクロゾーニング、第 22 回地盤震動シンポジウム、日本建築学会/翠川三郎・藤本一雄・村松郁栄(1999)計測震度と旧気象庁震度および地震動強さの指標との関係、地域安全学会論文集 1/防災科学技術研究所 J-SHIS 表層地盤(Z-V4、250 m メッシュの AVS30 と増幅率)を 2 km メッシュに平均して使用。J-SHIS の参考文献:若松加寿江・松岡昌志(2013)全国統一基準による地形・地盤分類 250m メッシュマップの構築とその利用、地震工学会誌 No.18/Wakamatsu, K. and Matsuoka, M. (2013) Nationwide 7.5-Arc-Second Japan Engineering Geomorphologic Classification Map and Vs30 Zoning, Journal of Disaster Research Vol.8 No.5/松岡昌志・若松加寿江(2008)地形・地盤分類 250m メッシュマップ全国版に基づく地盤のゆれやすさデータ、産業技術総合研究所/藤本一雄・翠川三郎(2006)近接観測点ペアの強震観測記録に基づく地盤増幅度と地盤の平均 S 波速度の関係、日本地震工学会論文集 Vol.6 No.1
このアプリで決めたこと:M8.5 を超える地震は、揺れの強さを M8.5 として計算すること(距離減衰式は M8.3 までの地震から作られているため。東日本大震災の観測と南海トラフの国の想定を見て決めました)。出す震度は平均的な値で、実際は場所によって 1 階級ほど上下します
3. 人口
2020 年国勢調査の 1 km メッシュ人口を使います。
出典:政府統計の総合窓口(e-Stat)令和 2 年国勢調査 地域メッシュ統計(3 次メッシュ人口)を加工
4. 建物の全壊
国の被害想定の「震度と全壊率の関係」を、建築時期ごとに使って全壊棟数を数えます。建物の数は市区町村ごとの住宅数で、木造は 5 つ・非木造は 3 つの建築時期に分けています。
出典:中央防災会議 首都直下地震対策検討ワーキンググループ(2013)首都直下地震の被害想定項目及び手法の概要/総務省統計局 令和 5 年住宅・土地統計調査 第 9-2 表(住宅の構造・建築の時期・建て方別住宅数)を加工
このアプリで決めたこと:全壊率の曲線は資料の図から読み取った近似です。計算した震度は平均的な値なので、上下のばらつき(計測震度で 0.3)を見込んでいます
5. 建物倒壊による死者
国の被害想定の式(木造の全壊 1 棟あたり 0.0676 人、非木造は 0.0084 人に人の割合の比を掛ける)で数えます。式は朝 5 時(ほとんどの人が家にいる時刻)の値なので、選んだ時刻に木造・非木造の建物の中にいる人の割合(朝 5 時との比)を掛けます。
出典:中央防災会議 首都直下地震対策検討ワーキンググループ(2013)首都直下地震の被害想定項目及び手法の概要(時間帯別の滞留者・移動者比率のグラフを含む)
このアプリで決めたこと:建物の中にいる人の割合は、国の資料の全国平均のグラフから読み取りました(朝 5 時 木造 60%・非木造 39.5%、昼 12 時 24%・71.5%、夕方 18 時 39.5%・52%)。全国平均なので、昼に都心へ人が集まる偏りは出ません
6. 津波
断層のうち浅い部分が海域にある M6.5 以上の地震で津波を発生させ、沿岸の津波高は阿部の式で、到達時刻は海の深さから求めます。陸では 500 m ごとの標高と比べて浸水域を決めます。死者は、国の被害想定の避難の手法(避難を始めるまでの時間・歩く速さ。夜は動き出しが 5 分遅く、歩く速さが 8 割)と、浸水の深さごとの死者率で数えます。
出典:阿部勝征(1989)地震と津波のマグニチュードに基づく津波高の予測、東京大学地震研究所彙報 64/中央防災会議 首都直下地震対策検討ワーキンググループ(2013)首都直下地震の被害想定項目及び手法の概要/海の深さ:NOAA ETOPO1(Amante, C. and Eakins, B.W., 2009)を加工/陸の標高:国土数値情報 標高・傾斜度 4 次メッシュ(国土交通省、原典は国土地理院 基盤地図情報 数値標高モデル)を加工
このアプリで決めたこと:陸では海岸から 1 km ごとに水位が 5 m 下がるとしたこと、大きな湾の奥(東京湾・伊勢湾・大阪湾と瀬戸内海・有明海)は津波高を 0.3 倍にして 4 m までは堤防で止まるとしたこと、断層の延長方向の海岸を低くする補正、避難の始め方ごとに掛ける合わせの係数(南海トラフ巨大地震の国の想定の、冬の深夜のすぐ避難 2 割で 21.5 万人・7 割で 9.4 万人・全員で 7 割減と、夏の昼の 2 割で 17.6 万人・7 割で 5.0 万人に合わせました。冬の夕方 18 時は、夜の扱いより国の数に近いので昼の扱いにしています。東日本大震災(午後 2 時 46 分)は、昼で計算すると、すぐ避難 2 割で約 1.7 万人と出て、実際の約 1.8 万人に近い数です)。浸水の深さごとの死者率は資料の図から読み取った近似です
7. 火災
国の被害想定の、時刻ごとの住宅の出火率と倒壊した建物からの出火率、初期消火率で出火件数を数えます。燃え広がりは、火事 1 件で焼ける棟数をその場所の木造住宅の密度に比例させて数え、死者は国の被害想定の式で数えます。
出典:中央防災会議 首都直下地震対策検討ワーキンググループ(2013)首都直下地震の被害想定項目及び手法の概要/同(2013)首都直下地震の被害想定と対策について(最終報告)別添資料 1(時刻・風速ごとの焼失棟数と火災の死者)/内閣府(2025)首都直下地震の被害想定/中央防災会議(2025)南海トラフ巨大地震 最大クラス地震における被害想定について【定量的な被害量】/兵庫県 阪神・淡路大震災の確定報(火災 293 件・焼損 7,574 棟)
このアプリで決めたこと:国の想定の消防力の計算と延焼シミュレーションの代わりに、火事 1 件で焼ける棟数(時刻と風速ごとに 103〜183 棟)と、死者に掛ける係数(冬の深夜 0.544・夏の昼 0.196・冬の夕方 0.298)を決めました。首都直下地震(2013 年想定の時刻・風速ごとの数に、2025 年の見直しの減り方を掛けたもの)と南海トラフ巨大地震(2025 年想定)の国の想定の、両方の真ん中に合わせています。住宅以外(飲食店・事務所など)からの出火は入れていません
8. 地図と、比べている数字
地図:国土地理院 地球地図日本(行政界)を加工。市区町村名は総務省 全国地方公共団体コード/国の想定と過去の地震の数字:内閣府(南海トラフ巨大地震 2025 年 3 月、首都直下地震 2025 年 12 月の被害想定、防災白書)、消防庁、警察庁、熊本県、石川県、気象庁の公表資料
含まないもの
土砂災害、液状化、災害関連死、長周期地震動による高層建物の被害、国の想定の 3 つ以外の時刻と季節、夏の海水浴客。北海道胆振東部地震のように、土砂災害による死者が多い地震もあります。南海トラフ巨大地震の国の想定では、災害関連死は 2 万 6 千〜5 万 2 千人と試算されています。
マグニチュードを大きくしても被害が増えにくい理由
- 1 か所の揺れの強さは、M8.5 で頭打ちにしています。距離減衰式は M8.3 までの地震から作られていて、式の形も断層のすぐ近くでは揺れが頭打ちになるようにできています。M を大きくしても、強く揺れる範囲が断層に沿って長くなるだけです
- 内陸の活断層は、地震を起こす深さの範囲(このアプリでは 20 km)で幅が止まるので、M を大きくすると長さだけが伸びます。M9.5 では長さが約 630 km になり、伸びた部分の多くは海の下や人の少ない地域にかかります。たとえば埼玉県春日部市の直下(深さ 10 km)を震源にすると、建物倒壊と火災の死者は M8.5 と M9.5 でほとんど変わらず、増える分のほとんどは、断層が海にかかって起きる津波です
- 実際の地震でも、東日本大震災(M9.0)で亡くなった人の 9 割以上は津波による溺死でした(警察庁、2011 年 4 月 11 日時点)
- 内陸の活断層で M8.1 を超える地震の記録はありません(最大級は 1891 年の濃尾地震、M8.0)。それより大きい内陸の地震は、計算のための仮定です
- 火災は時刻と風で大きく変わります。首都直下地震の国の想定(冬の夕方・風速 8 m)では、死者約 1.8 万人のうち約 1.2 万人が火災です。時刻を「冬の夕方 18 時」にすると、冬の深夜より火災の死者が数倍になります
About this simulator
The app's text is in English. Place names on the map are romanized, and the records of past earthquakes and the government estimates are summarized in English.
- This simulator estimates earthquake shaking and damage with simplified calculations. It is made for disaster education and research, and it does not predict the damage of any real earthquake
- Deaths, destroyed buildings and the population of flooded areas are shown as a range from half to twice the estimate, because the calculation differs from past records and the government's estimates by a factor of about 0.6 to 1.6. You can choose the same three times as the government's estimates (a winter night, noon in summer and 6 pm in winter). At noon fewer people are at home, so fewer die in collapsed buildings; at 6 pm in winter many people are cooking and heating, so fires grow larger
- Past great earthquakes are included to check the calculations against the records and to pass on their lessons. Their damage figures are estimates for the same earthquake striking today's buildings, not the damage that actually happened. We mourn those who lost their lives and extend our deepest sympathy to everyone affected
How to use
- Select a place on the map to see its seismic intensity and estimated damage. Choose "Make this the epicenter" to start an earthquake there. Changing the magnitude, depth or fault strike recalculates right away
- "Scenarios" shows the Nankai Trough megaquake and the Tokyo inland earthquake side by side with the government's published damage estimates. For the Nankai Trough you can also choose where the rupture starts
- "Past quakes" compares the calculated intensities with the observed ones, together with the records of the damage, including the main causes of death
- Deaths are split by cause (collapse, tsunami and fire) as shares. For earthquakes that cause a tsunami, change the share of people who evacuate at once (20%, 70% or all) to see how much tsunami deaths change. Changing the wind (3 m/s or 8 m/s) changes how far fires spread
- Areas are colored as the shaking reaches them. The clock shows the real time since the earthquake, and the map plays it fast-forward
- From a place's panel, "Shaking by floor" opens the Earthquake Shake Simulator with the same intensity
- The settings (earthquake, time, wind and evacuation) are kept in the page address, so you can share the link as it is
- Drag to move the map. Zoom with the buttons at the top right or with Ctrl and the mouse wheel. On a phone, pinch with two fingers
Methods and sources
The calculation combines and simplifies methods and data published by the Japanese government and research institutes. For each step, here are the equations and data, the sources, and what this app decided on its own (the parts that are not an official method).
1. Fault size
For inland faults and intraslab earthquakes, the fault length L comes from the magnitude M as L = 100.6M−2.9 km. For subduction earthquakes, the fault area S comes from log S = 1.02M − 4.01. The scenarios and past earthquakes use faults placed after the government estimates and the records.
Sources: Matsuda, T. (1975) Magnitude and recurrence interval of earthquakes from a fault, Zisin 2nd ser. 28, 269–283 (in Japanese) / Utsu, T. and Seki, A. (1955) A relation between the area of the aftershock region and the energy of the main shock, Zisin 2nd ser. 7, 233–240 (in Japanese)
Decided by this app: the maximum fault width (20 km inland, 30 km intraslab, 200 km for subduction)
2. Shaking (seismic intensity)
From the shortest distance between the fault plane and each place, the app computes the peak ground velocity on stiff ground (S-wave velocity 600 m/s), multiplies it by 1.31 to convert it to the engineering bedrock (400 m/s), applies the amplification of the surface ground and converts the result to the JMA instrumental seismic intensity. This is the same procedure as the "simplified method" of the National Seismic Hazard Maps for Japan. The arrival time assumes that the rupture spreads at 2.7 km/s and S waves at 3.5 km/s.
Sources: Headquarters for Earthquake Research Promotion, National Seismic Hazard Maps for Japan / Si, H. and Midorikawa, S. (1999) attenuation relationships for peak ground acceleration and velocity considering fault type and site condition, Journal of Structural and Construction Engineering, AIJ, No. 523 (in Japanese) / Matsuoka, M. and Midorikawa, S. (1994) seismic microzoning with the Digital National Land Information, 22nd Symposium on Ground Motion, AIJ (in Japanese) / Midorikawa, S., Fujimoto, K. and Muramatsu, I. (1999) correlation of the JMA instrumental seismic intensity with the former JMA intensity and ground motion parameters, Journal of Social Safety Science No. 1 (in Japanese) / NIED J-SHIS surface ground data (Z-V4, AVS30 and amplification on a 250 m mesh), averaged on a 2 km mesh. References for J-SHIS: Wakamatsu, K. and Matsuoka, M. (2013) Nationwide 7.5-Arc-Second Japan Engineering Geomorphologic Classification Map and Vs30 Zoning, Journal of Disaster Research Vol.8 No.5, and the related papers listed in the Japanese version
Decided by this app: earthquakes above M8.5 are calculated with the shaking strength of M8.5, because the attenuation relationship was built from earthquakes up to M8.3 (decided after checking the 2011 Tohoku observations and the government's Nankai Trough estimate). The intensity is an average value and varies by about one level from place to place
3. Population
The 2020 census population on a 1 km mesh.
Source: e-Stat, 2020 Population Census, grid square statistics (third-level mesh), processed
4. Destroyed buildings
The government's relationship between intensity and the rate of complete collapse is applied to each construction period. Buildings are the housing counts of each municipality, in five construction periods for wooden houses and three for other structures.
Sources: Central Disaster Management Council, working group on the Tokyo inland earthquake (2013), outline of the damage estimation items and methods (in Japanese) / Statistics Bureau of Japan, 2023 Housing and Land Survey, Table 9-2, processed
Decided by this app: the collapse curves are read from the figures in the report. Because the calculated intensity is an average, a spread of 0.3 in instrumental intensity is allowed for
5. Deaths from building collapse
The government's formula: 0.0676 deaths per completely collapsed wooden building, and 0.0084 for other structures multiplied by the ratio of occupants. The formula is for 5 am, when most people are at home, so it is multiplied by the share of people inside wooden and other buildings at the chosen time, relative to 5 am.
Source: Central Disaster Management Council (2013), outline of the damage estimation items and methods, including the chart of people indoors and on the move by hour (in Japanese)
Decided by this app: the shares of people indoors are read from the national average chart in the report (5 am: 60% in wooden and 39.5% in other buildings; noon: 24% and 71.5%; 6 pm: 39.5% and 52%). Because it is a national average, it does not show people gathering in city centers during the day
6. Tsunami
A tsunami is generated by earthquakes of M6.5 or more whose shallow part lies under the sea. Coastal tsunami heights come from Abe's equations and arrival times from the sea depth. On land, flooded areas are found by comparing the water level with the elevation of each 500 m cell. Deaths follow the government's evacuation method (the time before people start to evacuate and their walking speed; at night they start 5 minutes later and walk at 80% of the daytime speed) and death rates by flood depth.
Sources: Abe, K. (1989) estimating tsunami heights from earthquake and tsunami magnitudes, Bulletin of the Earthquake Research Institute, University of Tokyo 64 (in Japanese) / Central Disaster Management Council (2013), outline of the damage estimation items and methods (in Japanese) / sea depth: NOAA ETOPO1 (Amante, C. and Eakins, B.W., 2009), processed / land elevation: National Land Numerical Information, elevation and slope on the fourth-level mesh (MLIT, based on the GSI digital elevation model), processed
Decided by this app: the water level drops 5 m for every km inland; deep inside large bays (Tokyo Bay, Ise Bay, Osaka Bay and the Seto Inland Sea, the Ariake Sea) tsunami heights are 0.3 times the open-sea value and seawalls stop waves up to 4 m; coasts beyond the ends of the fault get lower waves; and the deaths in each evacuation group are scaled to match the government's Nankai Trough estimate (on a winter night, 215,000 when 20% evacuate at once, 94,000 at 70% and a 70% reduction when everyone does; at summer noon, 176,000 at 20% and 50,000 at 70%). 6 pm in winter is treated like daytime because that matches the government's figures better. The 2011 Tohoku earthquake (2:46 pm) gives about 17,000 deaths at 20%, close to the actual figure of about 18,000. The death rates by flood depth are read from figures in the report
7. Fire
The number of fires comes from the government's ignition rates for homes and for collapsed buildings at each time of day, and from the rate at which residents put out fires early. Each fire burns a number of buildings proportional to the density of wooden houses there, and deaths follow the government's formula.
Sources: Central Disaster Management Council (2013), outline of the damage estimation items and methods; final report on the Tokyo inland earthquake, Annex 1 (burned buildings and fire deaths by time and wind); Cabinet Office (2025), damage estimate for the Tokyo inland earthquake; Central Disaster Management Council (2025), damage estimate for the largest-class Nankai Trough earthquake, quantitative damage; Hyogo Prefecture, final report on the 1995 Great Hanshin-Awaji Earthquake (293 fires, 7,574 buildings burned) (all in Japanese)
Decided by this app: instead of the government's firefighting model and fire-spread simulation, the app sets the buildings burned per fire (103 to 183 depending on time and wind) and a factor for deaths (0.544 on a winter night, 0.196 at summer noon, 0.298 at 6 pm in winter). They are set midway between the government's Tokyo inland estimate (the 2013 figures for each time and wind, reduced as in the 2025 revision) and its Nankai Trough estimate (2025). Fires starting in shops and offices are not included
8. Map and the figures compared
Map: GSI Global Map Japan (boundaries), processed; municipality names from the Ministry of Internal Affairs and Communications local government codes, with romanized names from the Global Map / Government estimates and records of past earthquakes: the Cabinet Office (damage estimates for the Nankai Trough, March 2025, and the Tokyo inland earthquake, December 2025; White Paper on Disaster Management), the Fire and Disaster Management Agency, the National Police Agency, Kumamoto and Ishikawa prefectures and the Japan Meteorological Agency
Not included
Landslides, liquefaction, disaster-related deaths after the event, damage to high-rise buildings from long-period ground motion, times and seasons other than the government's three, and summer beachgoers. In some earthquakes, such as the 2018 Hokkaido Eastern Iburi earthquake, landslides caused most deaths. The government's Nankai Trough estimate puts disaster-related deaths at 26,000 to 52,000.
Why damage barely grows with magnitude
- The shaking strength at any one place stops growing at M8.5. The attenuation relationship was built from earthquakes up to M8.3, and its form also levels off close to the fault. A larger M only makes the strongly shaken zone longer along the fault
- Inland faults stop growing in width at the depth range where earthquakes occur (20 km in this app), so a larger M only makes them longer. At M9.5 the fault is about 630 km long, and most of the added length lies under the sea or in sparsely populated areas. With the epicenter under Kasukabe in Saitama (depth 10 km), for example, deaths from collapse and fire barely change between M8.5 and M9.5; almost all of the increase is from the tsunami caused where the fault reaches the sea
- In real earthquakes too, more than 90% of those who died in the 2011 Tohoku earthquake (M9.0) drowned in the tsunami (National Police Agency, as of April 11, 2011)
- No inland fault earthquake above M8.1 has been recorded (the largest is the 1891 Nobi earthquake, M8.0). Larger inland earthquakes are assumptions for the calculation
- Fire depends heavily on the time and wind. In the government's Tokyo inland estimate (6 pm in winter, 8 m/s wind), about 12,000 of about 18,000 deaths are from fire. Switching the time to 6 pm in winter multiplies fire deaths several times compared with a winter night